1
Watch how price moves down
See those bright lines popping up below price? Those are buy orders waiting to get filled.
Now watch the candles on the left. As sellers keep pushing, price moves toward those areas — while new liquidity appears lower and some older orders disappear.
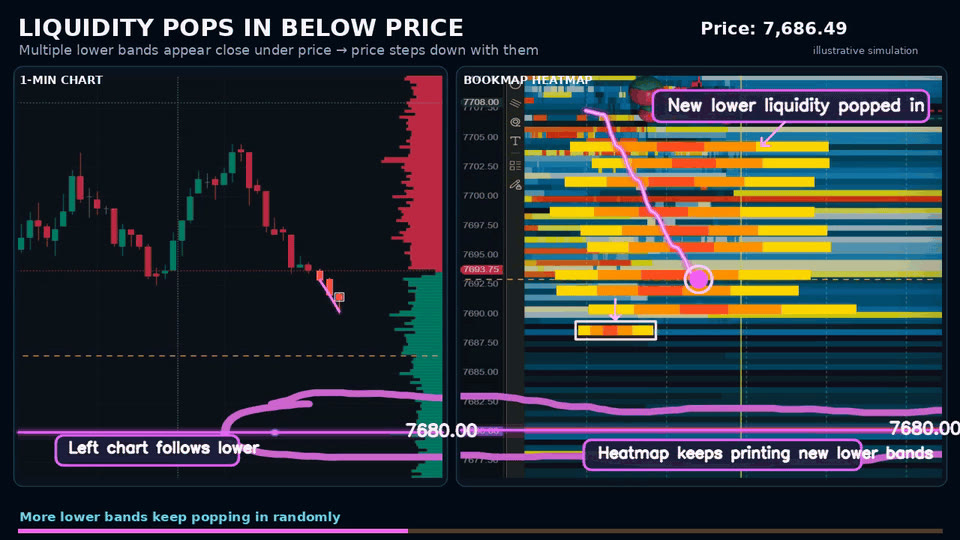
Educational simulation
1. Liquidity appears below price
New orders start showing up at lower levels.
2. Selling pressure comes in
Sellers hit available buy orders, pushing price lower.
3. Price approaches those areas
The resting orders may absorb selling, get filled, or disappear.
Key
"Big liquidity below price gives me an area to watch. But I still need sellers to show up before considering a move down."